View Job Results
A job can finish or stop for a variety of reasons such as:
- Completed (Successfully)
- Failed
- Node Failure
- Timeout
- Canceled
When these happen, you'll want to know the status of your job, results of your calculations, or any errors that appear.
Output Files
Beyond output emails created from your program itself, Slurm can direct standard output and error text for you to view in real-time. This is the same text as if you were running the program commands manually in the command prompt.
#SBATCH --output=output-%j.txt  # Standard Output Text
#SBATCH --error=error-%j.txt    # Standard Error Text
Using Variables?
The "%j" in the example above will automatically inject the id of your Slurm job into the file name. This will allow you to retain past Slurm output logs rather than overwriting them each time, which is very beneficial for troubleshooting.
For other variables you can use in your #SBATCH lines, check out this guide on Slurm's website.
Resource Usage
To view details about your job, such as what resources you requested and how much you used, we created the myjobreport command.
myjobreport jobid
Note: myjobreport works best for long-running jobs and may not collect enough information for anything that runs for just a few minutes.
[user@bose ~]$ myjobreport 101091
---------------------------
JOB DETAILS
---------------------------
Cluster: BOSE
Job ID: 101091
Job Name: my-new-job
State: COMPLETED (exit code 0:0)
Account: my-account
Submit Line: sbatch submit.sh
Working Dir: /path/to/directory


---------------------------
JOB TIMING
---------------------------
Submitted At: October 24, 2024 at 1:47:00 PM CDT
Started At: October 24, 2024 at 1:47:00 PM CDT
Ended At: October 24, 2024 at 1:55:50 PM CDT
Queue Time: 0-00:00:00 (0 Seconds)
Elapsed Time: 00:08:50 (8 Minutes 50 Seconds)
Time Limit: 7-00:00:00 (7 Days)

---------------------------
REQUESTED RESOURCES
---------------------------
Partition: week
Num Nodes: 1
CPU Cores: 64
Memory: 224.00G
Num GPUs: N/A

---------------------------
RESOURCE USAGE
---------------------------
Ran On: cn51
CPU Utilization: 28.88% - 02:43:17 Used / 0-09:25:20 Max
Memory Utilization: .17% - 394.29M Used / 224.00G Max

Resource usage is approximate and is only captured in Slurm at a set interval. Use the metrics dashboards below for additional and more real-time reporting.
Jobs that only take a few seconds may not report utilization.

---------------------------
METRICS
---------------------------

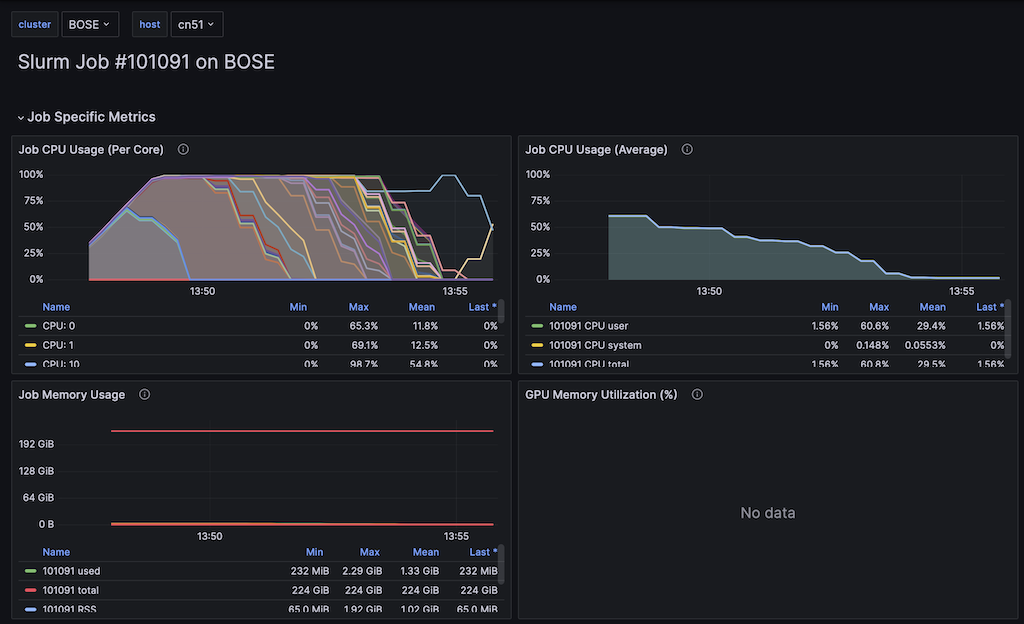
Copy the URLs below into your browser to see real-time stats about CPU and memory usage throughout your job's running time. You must be on campus or connected to the VPN to access the pages.

cn51 | https://metrics.hpc.uwec.edu/d/aaba6Ahbauquag/job-performance?orgId=1&theme=default&from=1729795619400&to=1729796150600&var-cluster=BOSE&var-host=cn51&var-jobid=101091&var-rawjobid=101091&var-gpudevice=nvidia0|nvidia1|nvidia2

---------------------------
USING ARRAYS?
---------------------------
Support for arrays is currently limited in this report and is still being worked on. To see statistics for each individual task, you can run "myjobreport jobid_tasknumber".


Have any questions about this job? Running into an issue and would like some advice? Send this report to BGSC.ADMINS@uwec.edu and we'd be glad to assist you.
Note that CPU and memory usage statistics are not perfect and are only captured every 30 seconds or so. This may cause a discrepancy, especially for jobs that quickly result in a "OUT_OF_MEMORY" error. Use this as a guideline, and check out the metric links to see how usage changes over time.
You can visit your job's metrics in our online Grafana dashboard by either clicking on the link (may have to hold ctrl or cmd first), or copy/pasting it into your web browser. Once on the page, you'll be able to see graphs showing your CPU memory, and GPU usage over the lifetime of your job, as well as metrics showing the shared node as a whole.

Email Notifications (Automatic Reports!)
The above job report is automatically sent to you if you enable email notifications in Slurm.
Set #SBATCH --mail-type=XXX to something other than "NONE" to receive emails.
By default emails are sent to your UWEC account unless you also use #SBATCH --mail-user=user@domain.com.